Blog
This blog was originally published on voxdev.org on 16 September 2025 here. It is reprinted with kind permission from VoxDev.
In his book Seeing Like a State, James Scott famously argued that modern states must be able to ‘see’ their societies in order to tax and govern (Scott 1998, Okunogbe 2025). In order to raise revenues to provide public goods and services the state must standardise and organise the economy. That means finding ways to measure the size of the tax base: each taxpayer’s ability to pay. But translating a messy social reality into neat tax categories is not easy – and sometimes the attempt backfires.
Keen and Slemrod (2021) recount the many oddities of tax history. Governments have taxed everything from playing cards to chimneys, often seeking observable proxies for hidden wealth. England’s infamous window tax is the most enduring case. Introduced in 1696, it taxed houses based on the number of windows they had. Unsurprisingly, homeowners bricked them up to reduce their liability, leaving some neighbourhoods literally in the dark. Economists often point to this as a lesson in moral hazard: tax a thing, and people will find ways to avoid it, generating efficiency losses (Oates and Schwab 2015).
There was also a different problem, noted eloquently by Adam Smith. The window tax, he argued, was “an inequality of the worst kind”. A modest country home might have more windows – and thus a higher tax – than a London mansion worth fifty times as much. The result was that poorer families shouldered a heavier burden than the rich (Smith 1776). Equally, families with similar wealth might face very different tax burdens simply because of the number of windows in their homes. The problem is that windows are a highly imperfect proxy for housing wealth and generate horizontal inequity – the unequal treatment of people who should be treated equally – as they inevitably create arbitrary differences in tax burdens between similar taxpayers.
The implications of using proxies to determine the tax base remains relevant today. In recent research (Best et al. 2025), we examine property taxation in Manaus, a city of two million people in the Brazilian state of Amazonas. Like many cities around the world, Manaus levies property tax not on true market values but on proxies that include geographic ‘sectors’ with set land values.
Figure 1: Tax sector boundaries
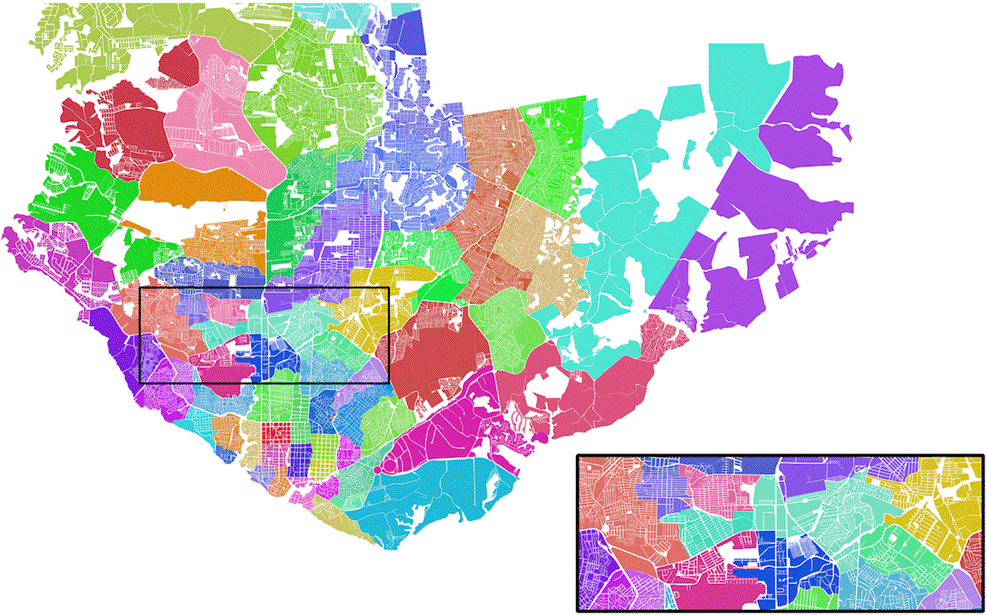
The city divides properties into 63 tax sectors, each with its own assessed land price per square meter. While this system simplifies tax administration – as it is easier to update coarse land data on 63 sectors than hundreds of thousands of land prices – it also generates inequities. Two nearly identical houses on opposite sides of a street boundary can face very different tax bills – which citizens notice. In fact, we find that compliance is about 8% lower on the side of the boundary where assessed values are higher.
Figure 2: Sectors create arbitrary boundaries

Crucially, we find that this wasn't just because taxes were higher. When faced with higher taxes, people might reduce compliance for two distinct reasons:
We examine two different behavioural responses: reactions to tax levels versus reactions to perceived unfairness.
To separate the effect of higher tax levels from the effect of unfairness, we construct a novel measure of inequity: the ratio between a household’s actual tax bill and the counterfactual bill it would face if located across the street. Using a boundary discontinuity design, along with a 2011 reform that changed assessed values, we estimate that roughly half of the drop in compliance at tax sector boundaries is explained by inequity alone – not by the level of tax liability.
Figure 3: Overall change in compliance at tax sector boundaries
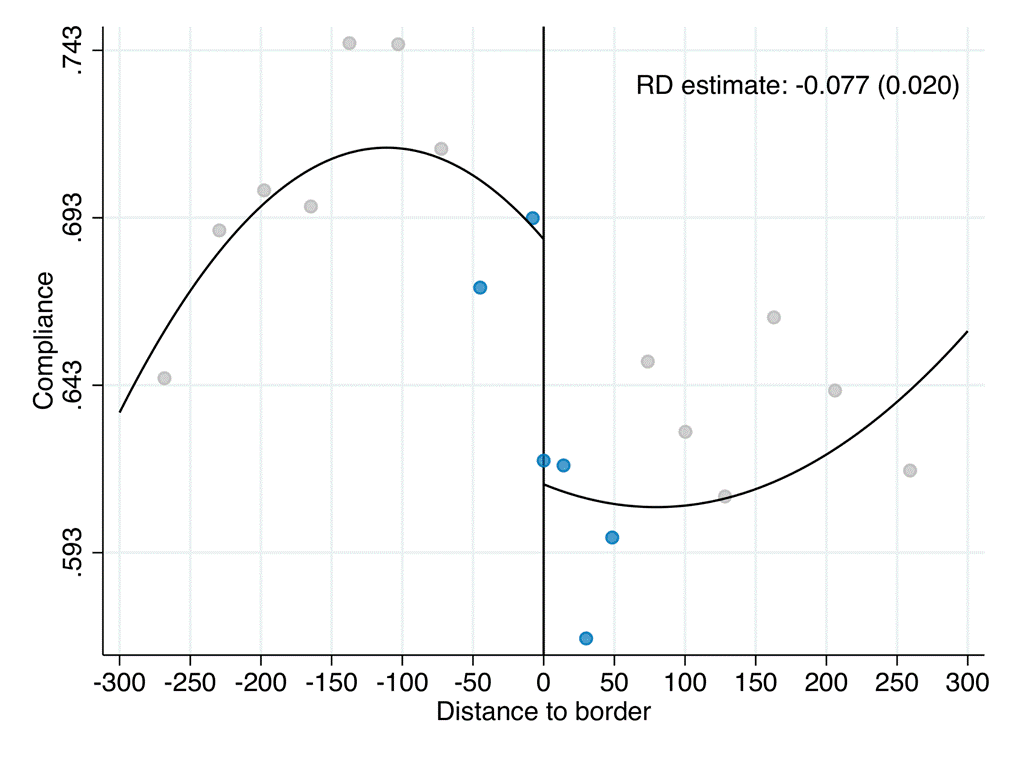
In other words, households don’t just respond to how much they are taxed. They respond to whether the tax seems fair. Over-assessed households pay less; under-assessed neighbours don’t pay more out of gratitude. The asymmetry suggests that resentment drives behaviour, not reciprocity.
The distinction between responses to own taxes versus inequities matters a lot for policy design. These two forces push optimal tax policy in opposite directions. When people respond mainly to tax levels, governments should make taxes more progressive (higher rates on valuable properties). But when people respond to unfairness, governments should make taxes less progressive to reduce the inequity created by imperfect tagging.
Our findings thus have consequences for tax progressivity. If compliance falls sharply in response to inequity, the optimal property tax schedule is much less progressive than theory would suggest. In fact, our model implies that optimal progressivity is around 50% lower once we account for inequity responses.
But there is also good news. Investments in fiscal capacity – better data and valuation methods – can reduce inequity. Using online property listing data, we estimate that relatively simple machine-learning approaches could reduce mistagging, allowing for greater progressivity without undermining compliance. As property markets increasingly move online, the data needed for such improvements becomes readily available. Other investments such as drone imagery, among other digital solutions, could make the tax base more observable and minimise the inequity effects on compliance.
Our research offers several key insights for policymakers:
The state's ability to ‘see’ may determine its capacity to govern, but how citizens see the state may matter just as much.
Best, M, L Caloi, F Gerard, E Kresch, J Naritomi, and L Zoratto (2025), “Greener on the other side: Inequity and tax compliance,” NBER Working Paper.
Keen, M, and J Slemrod (2021), "Rebellion, rascals, and revenue: Tax follies and wisdom through the ages," Princeton University Press.
Oates, W E, and R M Schwab (2015), “The window tax: A case study in excess burden,” Journal of Economic Perspectives 29(1): 163–80.
Okunogbe, O (2025), “Becoming legible to the state: The essential but incomplete role of identification capacity in taxation,” CEPR Discussion Paper.
Scott, J (1998), "Seeing like a state," Yale University Press.
Smith, A (1776), "An inquiry into the nature and causes of the wealth of nations."
Published on: 24th November 2025
Print